Resources
Data trends. Martech best practices. Hot takes. The strategies and solutions shaking up the market. Get all that and more in MessageGears’ resource library. We’re full of insights on customer engagement, data activation, and personalization.

Blogs

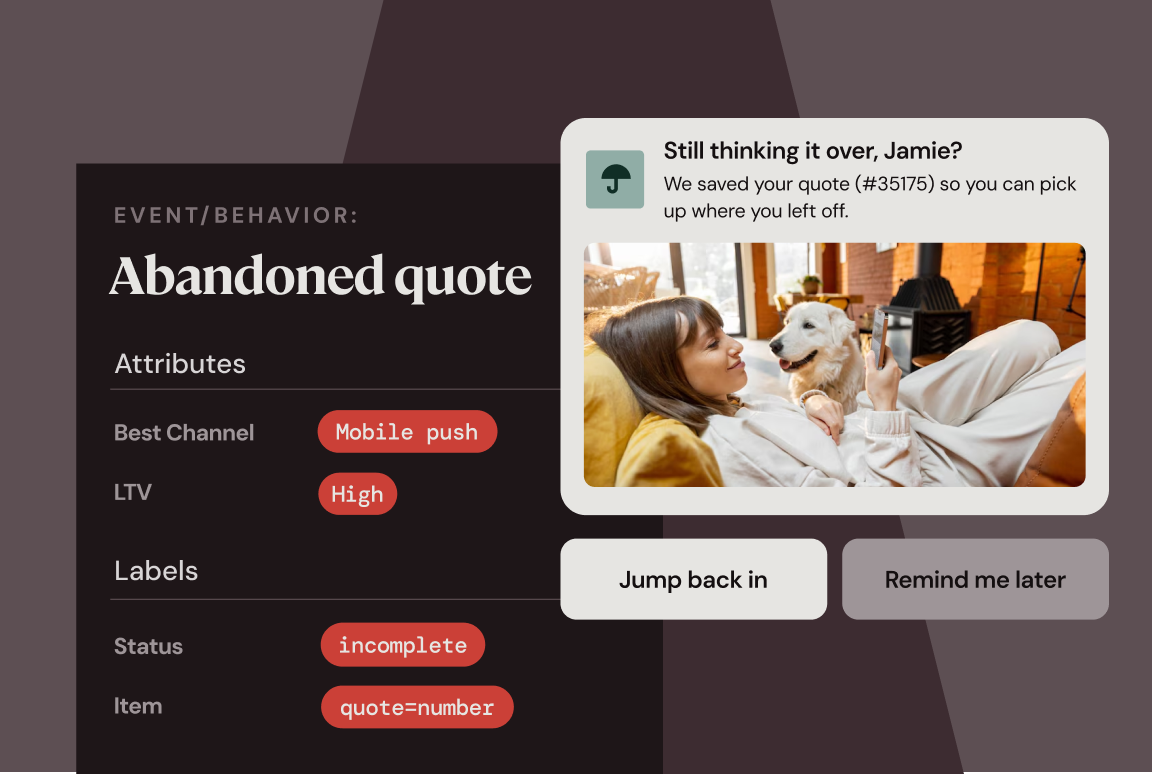
10 signs your brand is ready for warehouse-native marketing
Read more about 10 signs your brand is ready for warehouse-native marketing

Data governance for healthcare marketers: Balancing personalization and patient privacy
Read more about Data governance for healthcare marketers: Balancing personalization and patient privacy
Engaging customers in the insurance industry without sounding like every other provider
Read more about Engaging customers in the insurance industry without sounding like every other provider

5 tips for vetting SaaS vendors to avoid falling for martech hype
Read more about 5 tips for vetting SaaS vendors to avoid falling for martech hype

Data protection in the insurance sector: Why your martech stack matters
Read more about Data protection in the insurance sector: Why your martech stack matters
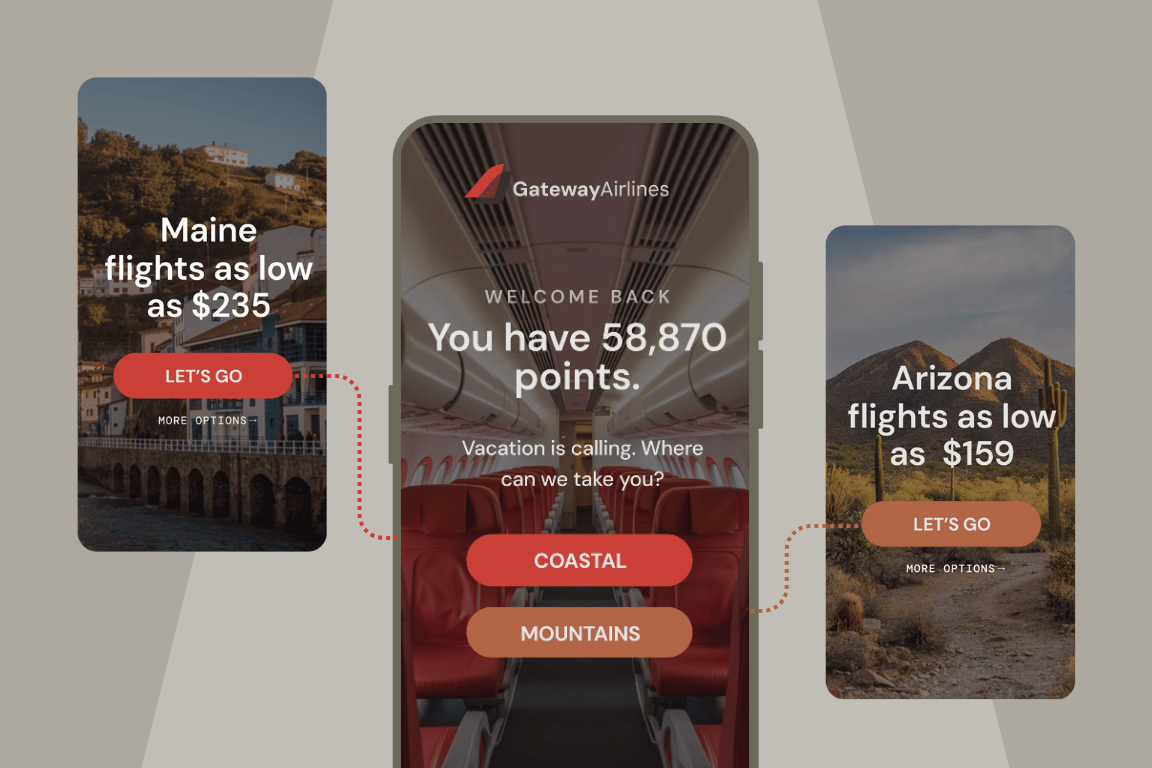
Dynamic segmentation: Harnessing live user behavior for real-time impact
Read more about Dynamic segmentation: Harnessing live user behavior for real-time impact
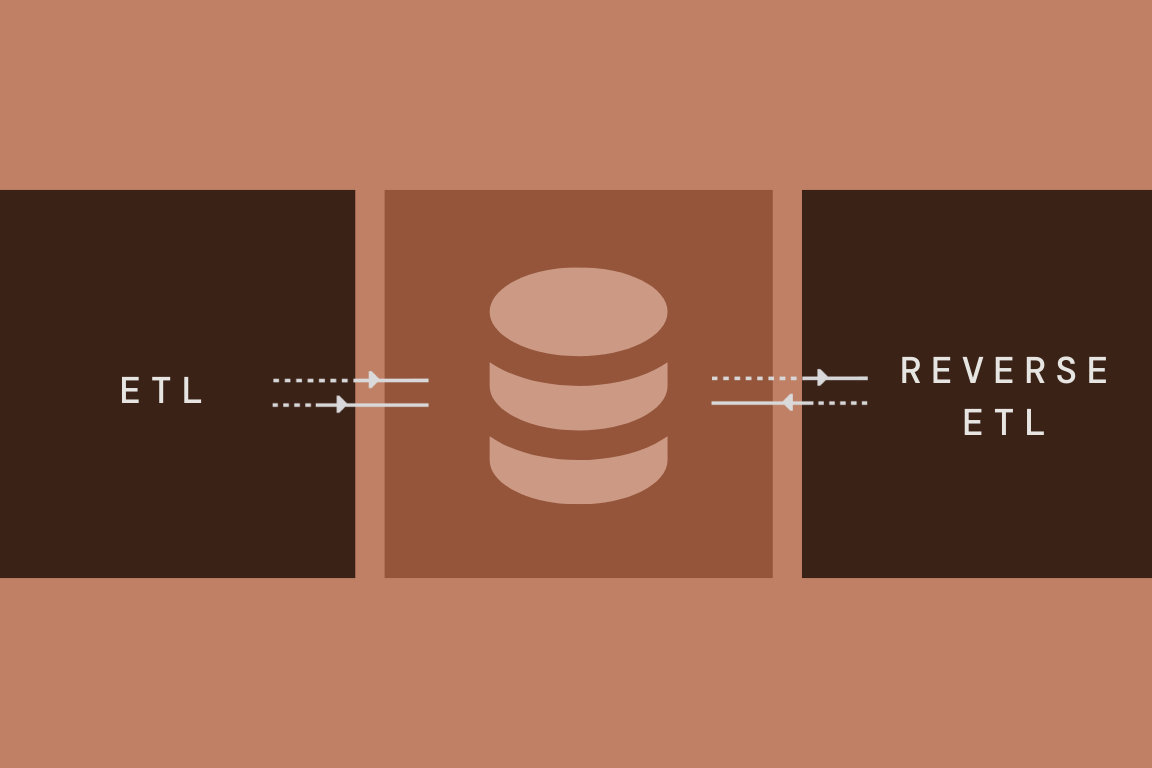
ETL vs. reverse ETL: What’s the difference?
Read more about ETL vs. reverse ETL: What’s the difference?

Audience segmentation tools for smarter marketing
Read more about Audience segmentation tools for smarter marketing
Case studies

Chick-fil-A uses MessageGears to ensure customer privacy
Read more about Chick-fil-A uses MessageGears to ensure customer privacy

How OpenTable reduced campaign production time by 80% with MessageGears
Read more about How OpenTable reduced campaign production time by 80% with MessageGears

MessageGears helps Musictoday send more personalized, dynamic content
Read more about MessageGears helps Musictoday send more personalized, dynamic content

MessageGears is a catalyst for growth at Active Engagement
Read more about MessageGears is a catalyst for growth at Active Engagement

Telefónica uses real-time targeting to drive mobile app activation, engagement, and retention
Read more about Telefónica uses real-time targeting to drive mobile app activation, engagement, and retention

Digicel triples mobile engagement and increases retention by over 50%
Read more about Digicel triples mobile engagement and increases retention by over 50%

Three UK increases revenue by 79% with real-time mobile messaging
Read more about Three UK increases revenue by 79% with real-time mobile messaging

MessageGears and Snowflake help OpenTable take full control of their data
Read more about MessageGears and Snowflake help OpenTable take full control of their data
Guides
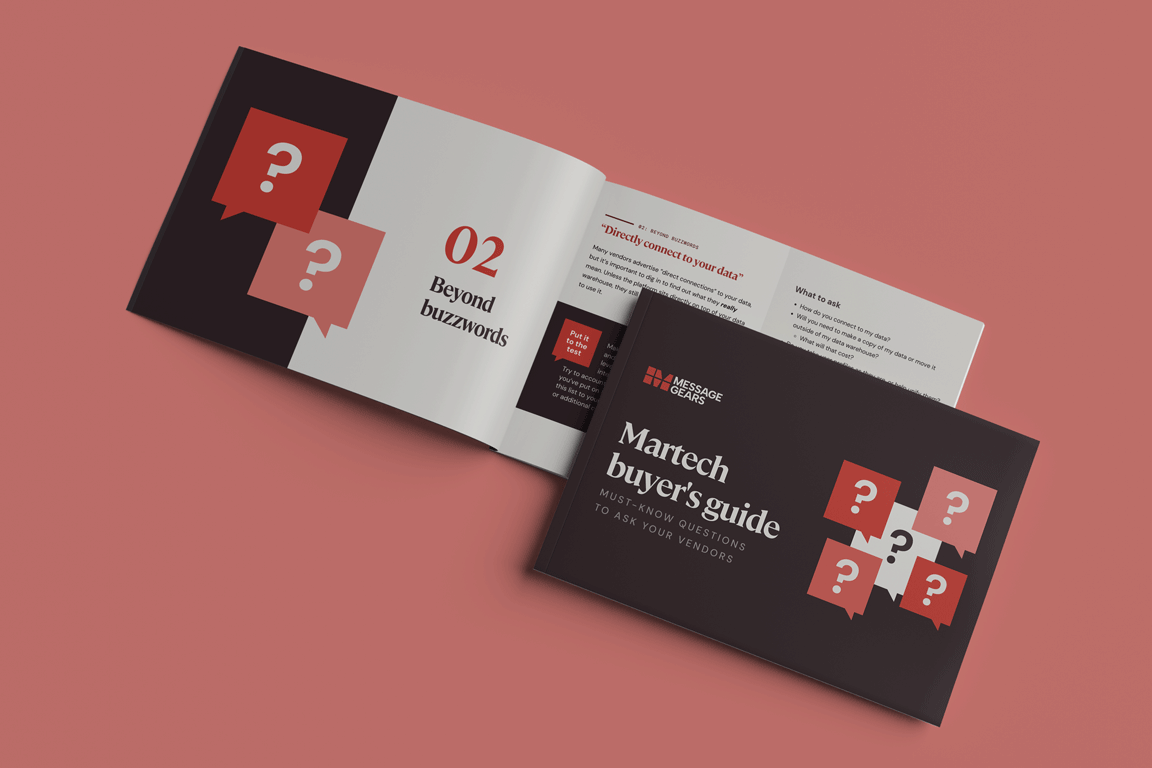
Martech buyer’s guide
Read more about Martech buyer’s guide
A retailer’s guide to better data activation in marketing channels
Read more about A retailer’s guide to better data activation in marketing channels
Your guide to better data activation
Read more about Your guide to better data activation
MessageGears consumer engagement report
Read more about MessageGears consumer engagement report
The guide to your Salesforce divorce
Read more about The guide to your Salesforce divorce
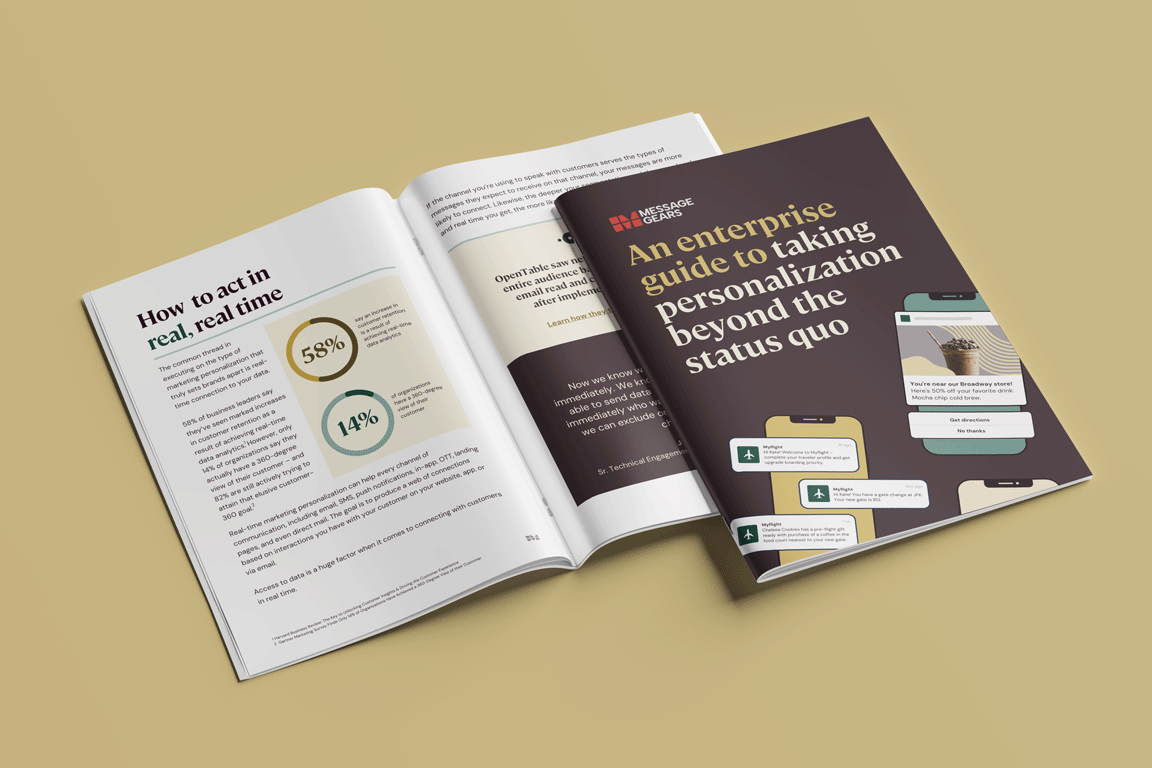
The enterprise guide to taking personalization beyond the status quo
Read more about The enterprise guide to taking personalization beyond the status quo
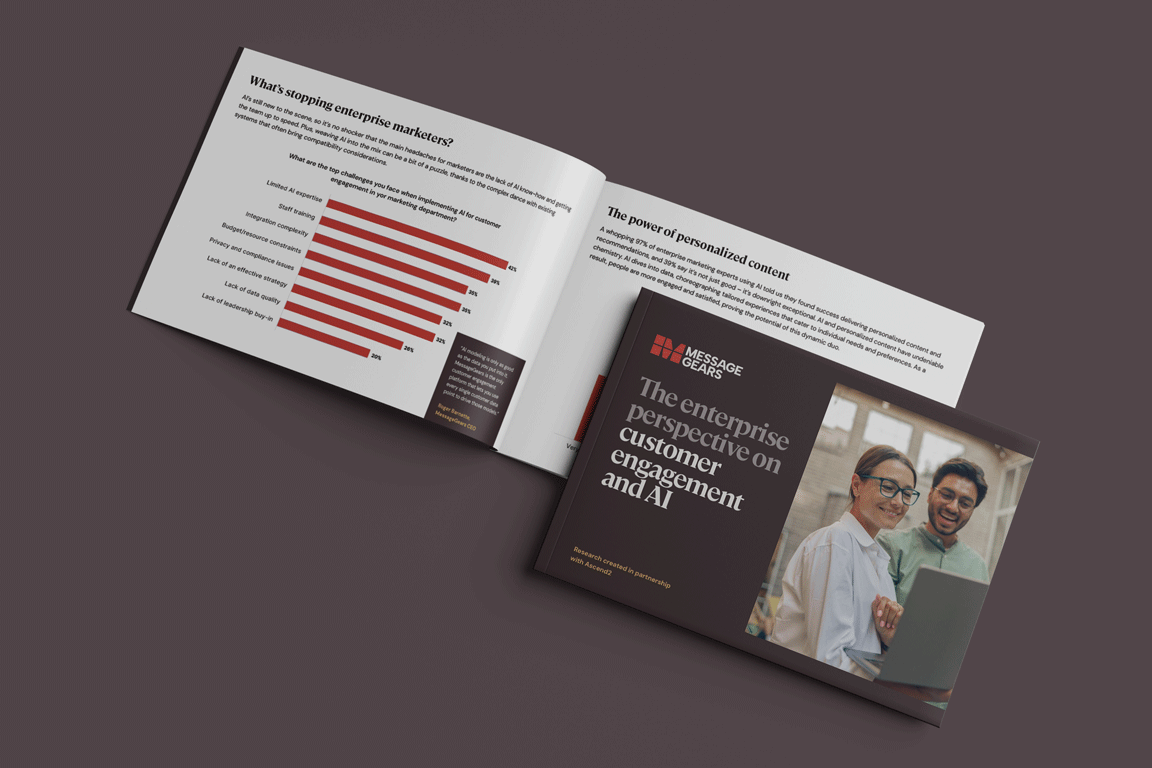
The enterprise perspective on AI and customer engagement
Read more about The enterprise perspective on AI and customer engagement
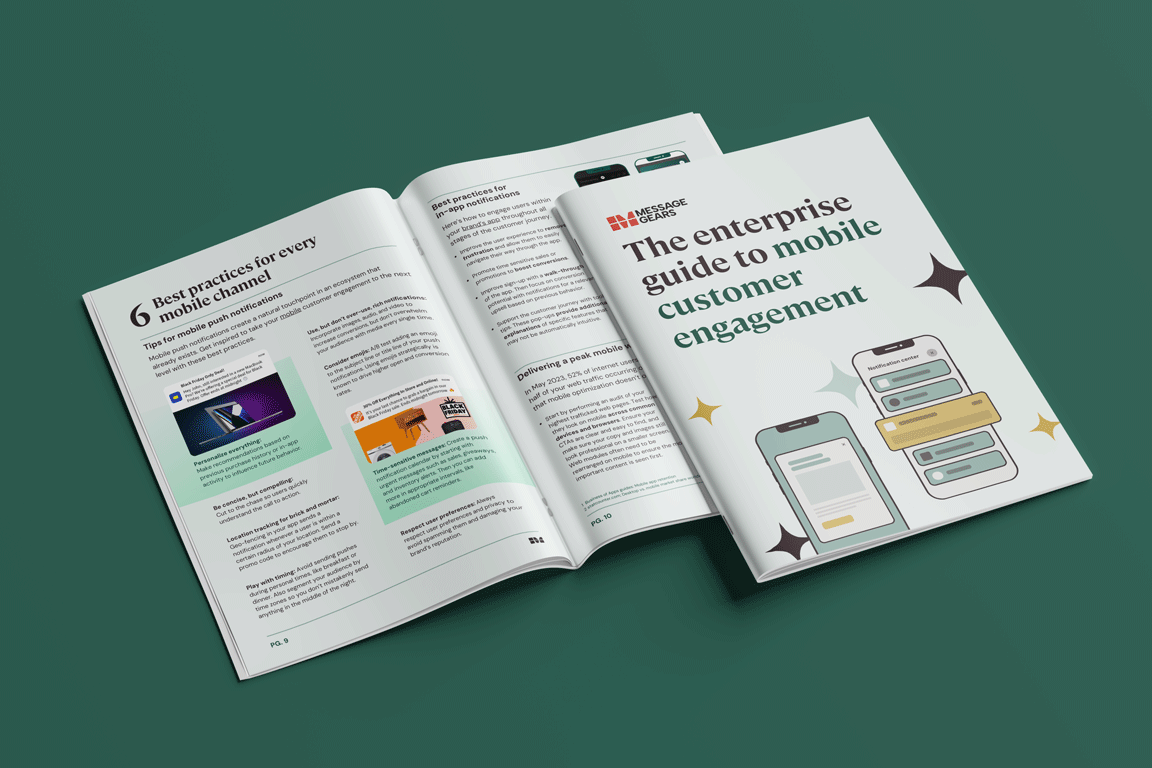
The enterprise guide to mobile customer engagement
Read more about The enterprise guide to mobile customer engagement
Events
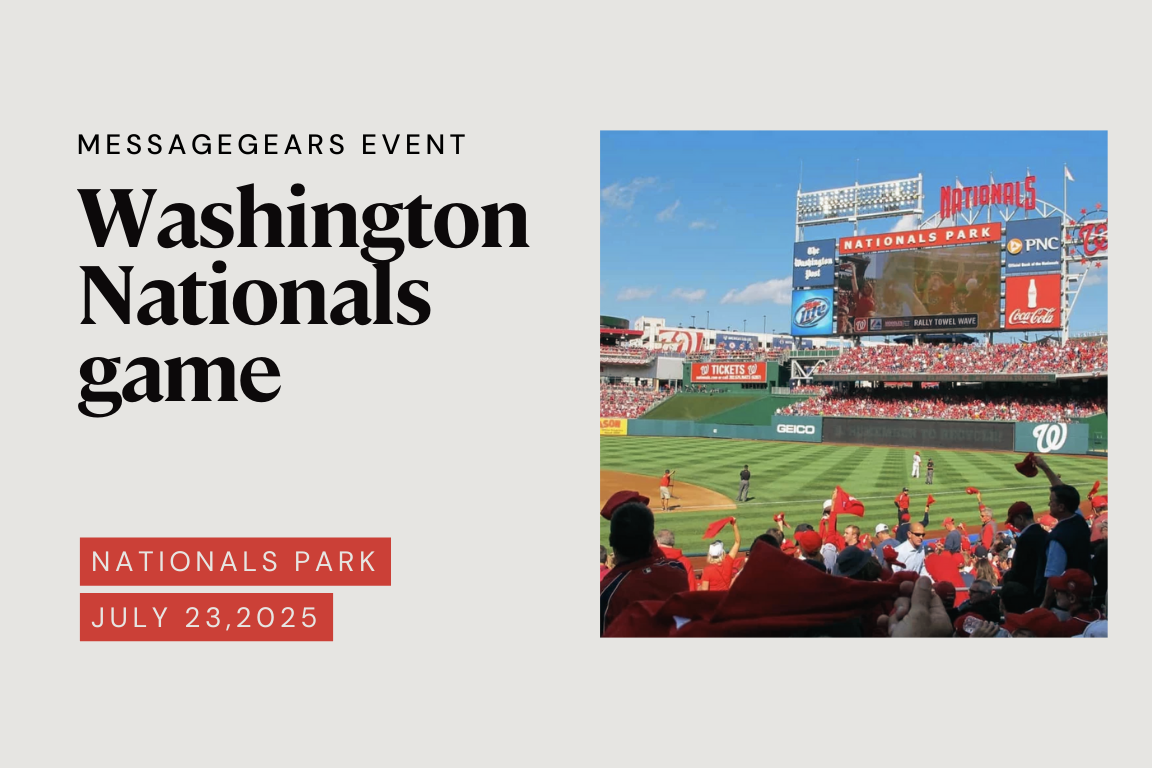
Washington Nationals game
Learn more

Texas Rangers Game
Learn more

Seattle Mariners game
Learn more

eTail East
Learn more

New York Yankees game
Learn more

Arizona Diamondbacks game
Learn more
News
MessageGears partners with Databricks to power native data activation in enterprise marketing campaigns
Read more about MessageGears partners with Databricks to power native data activation in enterprise marketing campaigns
MessageGears announces enterprise campaign efficiencies for data-driven brands
Read more about MessageGears announces enterprise campaign efficiencies for data-driven brands
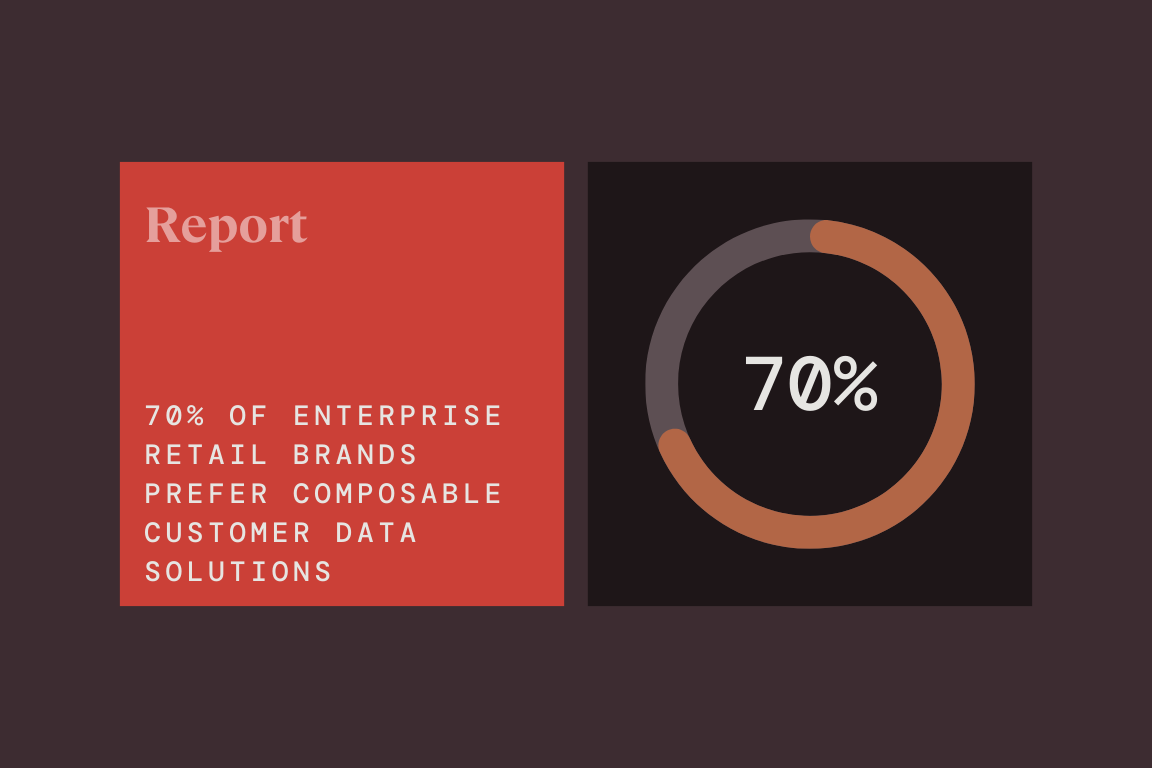
MessageGears report reveals 70% of enterprise retail brands prefer composable customer data solutions
Read more about MessageGears report reveals 70% of enterprise retail brands prefer composable customer data solutions

MessageGears predicts key consumer enterprise brand trends for 2025
Read more about MessageGears predicts key consumer enterprise brand trends for 2025

New MessageGears and Smartling integration powers email translation for Vimeo
Read more about New MessageGears and Smartling integration powers email translation for Vimeo
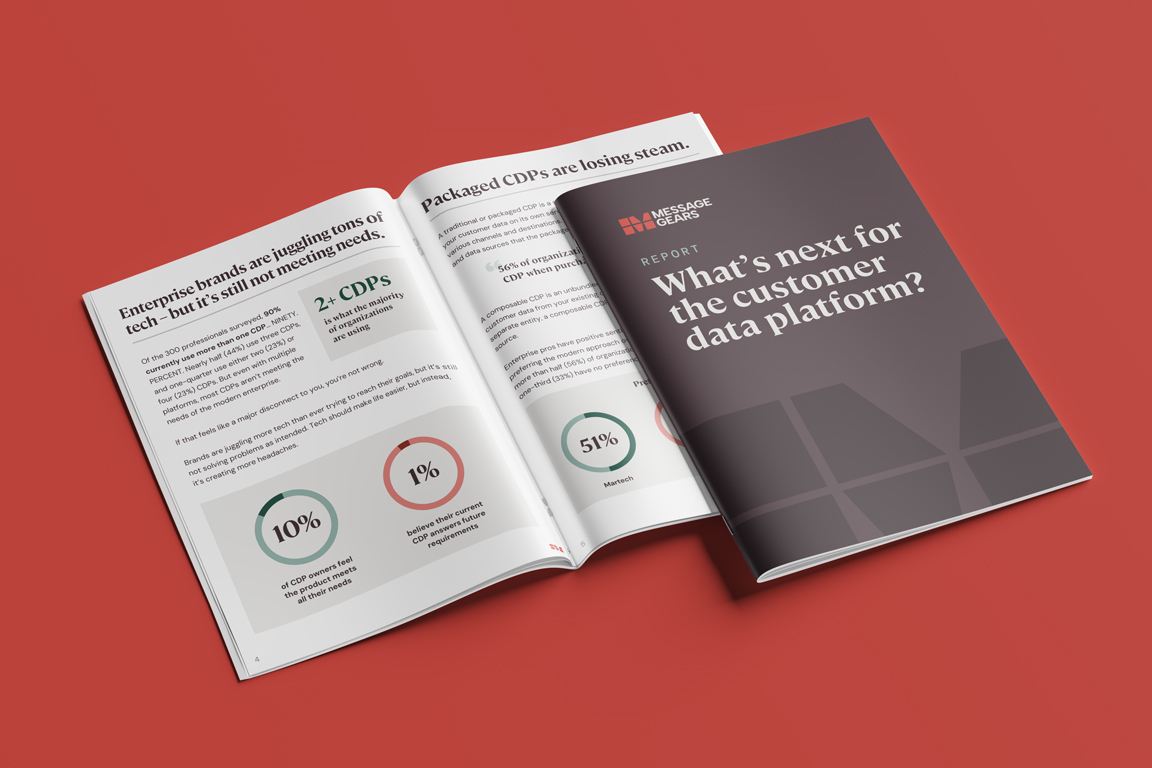
MessageGears report reveals packaged CDPs are losing steam with 56% of brands preferring composability
Read more about MessageGears report reveals packaged CDPs are losing steam with 56% of brands preferring composability
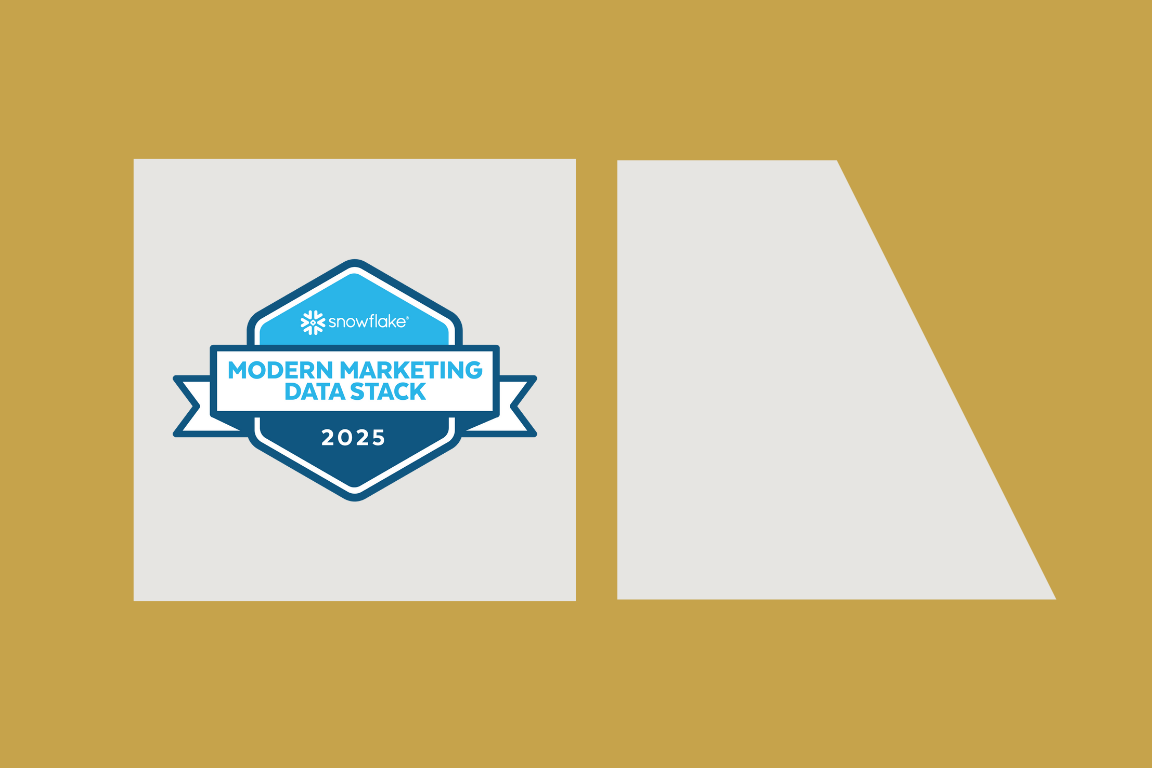
MessageGears recognized as “One to Watch” in Snowflake’s Modern Marketing Data Stack Report
Read more about MessageGears recognized as “One to Watch” in Snowflake’s Modern Marketing Data Stack Report
MessageGears launches the first composable end-to-end data activation and engagement platform
Read more about MessageGears launches the first composable end-to-end data activation and engagement platform
Webinars

Crawl, walk, run: How to implement a composable CDP
Read more about Crawl, walk, run: How to implement a composable CDP

Understanding composable CDPs
Read more about Understanding composable CDPs

How Chewy creates truly cross-channel campaigns with direct mail
Read more about How Chewy creates truly cross-channel campaigns with direct mail

Choosing the right martech to solve your data problems
Read more about Choosing the right martech to solve your data problems

How GoDaddy went from messy lists to campaign excellence
Read more about How GoDaddy went from messy lists to campaign excellence

Predictive AI trends for customer-obsessed brands
Read more about Predictive AI trends for customer-obsessed brands

7 email re-engagement tips to win back your audience
Read more about 7 email re-engagement tips to win back your audience

Ignite your marketing engine with the power of the data cloud
Read more about Ignite your marketing engine with the power of the data cloud